GTM Performance: Fixing the Metrics That Actually Drive Growth


Last quarter, I watched a $15M ARR SaaS company celebrate hitting 120% of their MQL target while missing revenue by 23%. Their board was furious. The CMO was confused. The CRO blamed marketing. This scenario plays out weekly across the B2B SaaS landscape because most companies measure activity, not gtm performance. They track vanity metrics while their actual revenue engine sputters. Let me show you what actually matters when you're scaling from $3M to $75M ARR.
What GTM Performance Actually Measures
GTM performance isn't about how many campaigns you run or leads you generate. It's about whether your go-to-market strategy converts market opportunity into predictable revenue at acceptable unit economics.
The companies that scale successfully track three core dimensions:
- Pipeline efficiency: 3-5x coverage with consistent stage conversion rates
- Unit economics: CAC payback under 18 months, LTV:CAC above 3:1
- Execution velocity: Time from MQL to closed-won trending downward
Everything else is noise. If you can't connect a metric directly to revenue or efficiency, stop tracking it.
The Pipeline Coverage Trap
Most B2B SaaS teams chase the wrong pipeline number. They celebrate when they hit 3x coverage without asking whether that pipeline actually converts. I've seen $25M ARR companies with 5x coverage and 8% win rates. That's not healthy coverage, that's a broken qualification process.
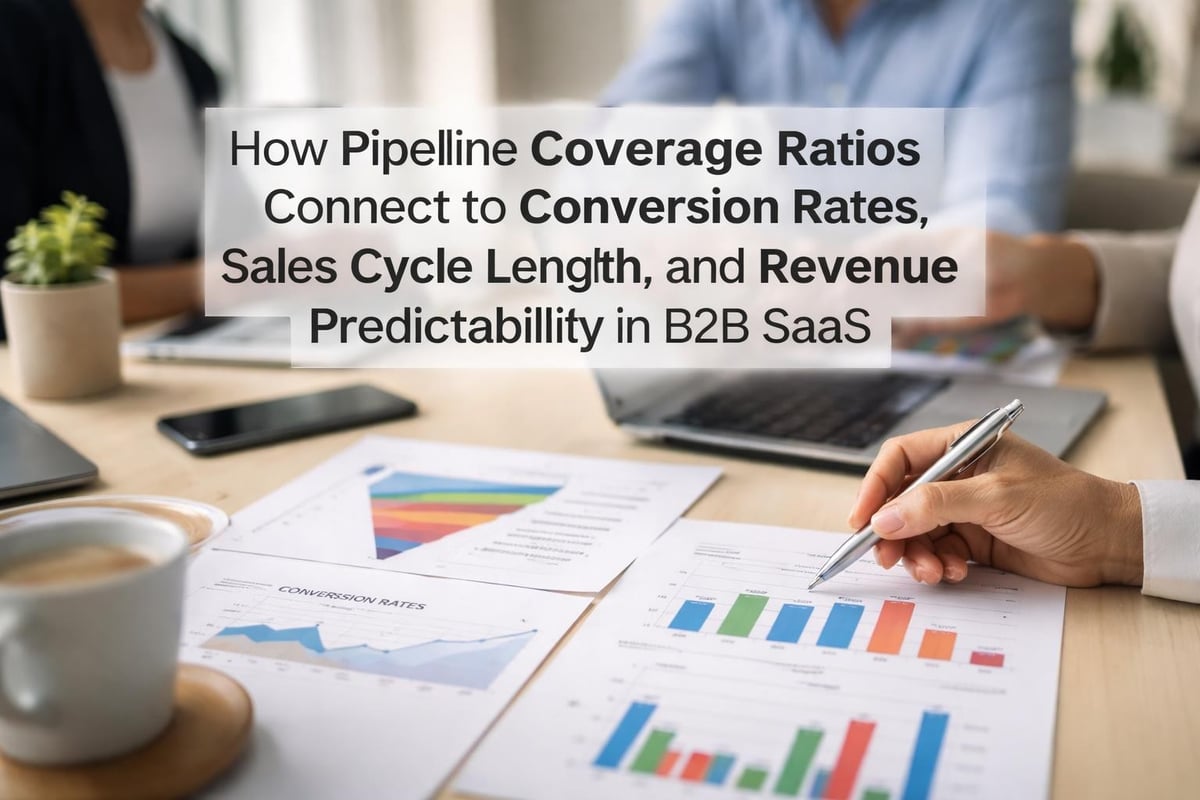
Real gtm performance requires mapping coverage to historical conversion data. If your average win rate is 15%, you need 6.7x coverage to hit quota, not 3x. Factor in stage-by-stage decay rates. Most SaaS companies lose 40-60% of pipeline between demo and proposal.
Here's what healthy coverage looks like at different ARR levels:
| ARR Stage | Pipeline Coverage | Win Rate Benchmark | Avg Sales Cycle |
|---|---|---|---|
| $3M-$10M | 4-6x | 12-18% | 60-90 days |
| $10M-$25M | 3-5x | 18-25% | 90-120 days |
| $25M-$75M | 3-4x | 22-30% | 120-180 days |
These benchmarks assume you're tracking real GTM metrics, not just reporting whatever your CRM spits out.
Regional Execution Compounds or Kills Performance
The moment you expand beyond your home market, gtm performance becomes exponentially more complex. US-based SaaS companies expanding into EMEA routinely underestimate how much their conversion rates, sales cycles, and CAC will shift.
I worked with a $40M ARR company that assumed their US playbook would translate directly to Germany. Their CAC in DACH ended up 2.3x higher than projected because they didn't account for longer sales cycles, different buying committees, or localization requirements.
The Cross-Regional Performance Framework
When evaluating gtm performance across regions, you need separate scorecards:
US Market Metrics
- Faster sales cycles (baseline)
- Higher self-serve adoption rates
- Direct response marketing performs better
- Lower touch sales models scale efficiently
EMEA/DACH Considerations
- 30-50% longer sales cycles
- Relationship-driven buying processes
- Content and trust-building required earlier
- Compliance and data sovereignty impact positioning
Companies that scale profitably across regions don't just translate content. They rebuild their go-to-market operating system for each market's buying behavior and competitive dynamics.
Many mid-stage B2B SaaS companies benefit from fractional CMO guidance when expanding into new regions, avoiding the expensive mistakes that come from applying a single-region playbook to a multi-market reality.
Sales-Led vs PLG Performance Indicators
Your gtm performance metrics change dramatically based on your primary motion. Sales-led and product-led growth models require completely different measurement frameworks, yet most companies try to track both with the same dashboard.

Sales-Led Performance Indicators:
- Opportunity creation rate per AE
- Average deal size and expansion revenue
- Quota attainment distribution across reps
- Win rate by competitor and deal size
PLG Performance Indicators:
- PQL activation rate and time-to-value
- Free-to-paid conversion percentage
- Expansion revenue from product usage
- User engagement leading conversion events
The companies stuck between these models suffer the worst gtm performance. They have a sales team chasing small deals and a product team wondering why self-serve doesn't convert. Pick your primary motion, build the infrastructure to support it, and measure accordingly.
Most B2B SaaS companies at $10M+ ARR end up with hybrid models, which requires even more discipline around measurement and attribution.
The Execution Cadence That Fixes Performance
Strategy doesn't fix gtm performance. Execution discipline does. The difference between companies that hit their numbers and those that miss comes down to operational cadence.
Here's the weekly review structure that high-performing GTM teams use:
- Monday pipeline review: Stage movement, stalled deals, coverage gaps
- Wednesday conversion analysis: Win/loss patterns, objection trends, competitive intel
- Friday forecast lock: Commit numbers, risk assessment, next week priorities
This isn't bureaucracy. It's how you catch performance issues before they compound into missed quarters. When conversion rates start dropping or sales cycles extend, you need to know within days, not months.
Track these leading indicators of GTM success weekly:
| Metric | What It Reveals | Warning Threshold |
|---|---|---|
| Demo-to-trial conversion | Solution fit and messaging | <30% for SLG, <5% for PLG |
| Days in stage | Process friction | >20% increase |
| Discount depth trending | Competitive pressure or value gaps | >15% average |
| Multi-thread engagement | Deal quality | <2 contacts per opp |
These metrics give you 4-6 weeks advance warning before pipeline quality degrades into revenue misses.
AI and Automation's Impact on GTM Performance
Every B2B SaaS executive asks how AI improves gtm performance. The honest answer: it depends entirely on what you're optimizing and whether you have clean data to train models against.
AI delivers measurable performance gains in three areas. First, conversation intelligence tools surface objection patterns and coaching opportunities faster than manual review. Second, predictive scoring models help reps prioritize deals with genuine intent. Third, automated outbound sequences free reps to focus on active opportunities rather than top-of-funnel prospecting.
But AI amplifies your existing motion. If your qualification process is broken, AI just helps you disqualify faster. If your messaging doesn't resonate, AI helps you send more emails that don't convert.
The companies seeing 20-40% conversion rate improvements from AI started with solid fundamentals. They knew their ICP, had documented their buyer journey, and could articulate their value proposition in customer language. AI made them faster and more consistent, not fundamentally better at building go-to-market engines.

PE-Backed Performance Standards
Private equity firms have transformed how we think about gtm performance. They demand operational rigor and predictable growth that most founder-led companies haven't built.
PE-backed SaaS companies typically face these performance expectations:
- Monthly revenue predictability within 5% of forecast
- Pipeline generation tied directly to bookings outcomes
- Clear attribution models across all channels
- Documented, repeatable sales processes
These aren't arbitrary standards. They're the minimum requirements for scaling past $25M ARR without constant firefighting. Companies that build these capabilities early scale faster and more profitably than those that retrofit them under board pressure.
The best-performing PE-backed SaaS companies implement comprehensive GTM assessments within their first 90 days post-acquisition. They baseline current performance, identify the three biggest bottlenecks, and build 12-month improvement plans before the honeymoon period ends.
Building Your Performance Scorecard
Stop tracking everything. Start measuring what matters. Your gtm performance scorecard should fit on one page and answer three questions: Are we generating enough pipeline? Are we converting it efficiently? Are our unit economics sustainable?
Here's the exact framework that works for B2B SaaS companies between $3M and $75M ARR:
Pipeline Generation (40% weight)
- Net new pipeline created vs target
- Pipeline by source and campaign
- Coverage ratio by segment and region
Conversion Efficiency (40% weight)
- Stage-by-stage conversion rates
- Average sales cycle length
- Win rate by deal size and competitor
Unit Economics (20% weight)
- CAC payback period trending
- LTV:CAC ratio by segment
- Net revenue retention rate
Review these metrics weekly at the leadership level and monthly at the board level. Build dashboards that show trends, not just point-in-time snapshots. When metrics move outside acceptable ranges, you have 72 hours to diagnose root cause and deploy corrective action.
This operational discipline separates companies that predictably scale from those that lurch between good and bad quarters. Your go-to-market strategy is only as good as your ability to measure and optimize execution.
Optimizing gtm performance requires equal parts strategic clarity and operational discipline. The companies that scale predictably from $3M to $75M ARR measure what matters, act on leading indicators, and build execution systems that compound performance improvements quarter over quarter. GTM Consult helps B2B SaaS leadership teams build these scalable go-to-market engines through hands-on fractional CMO support, comprehensive GTM assessments, and cross-regional expansion alignment that delivers 3-5x pipeline coverage and 20-40% higher conversions across US, EMEA, and DACH markets.

Latest From
The Blog

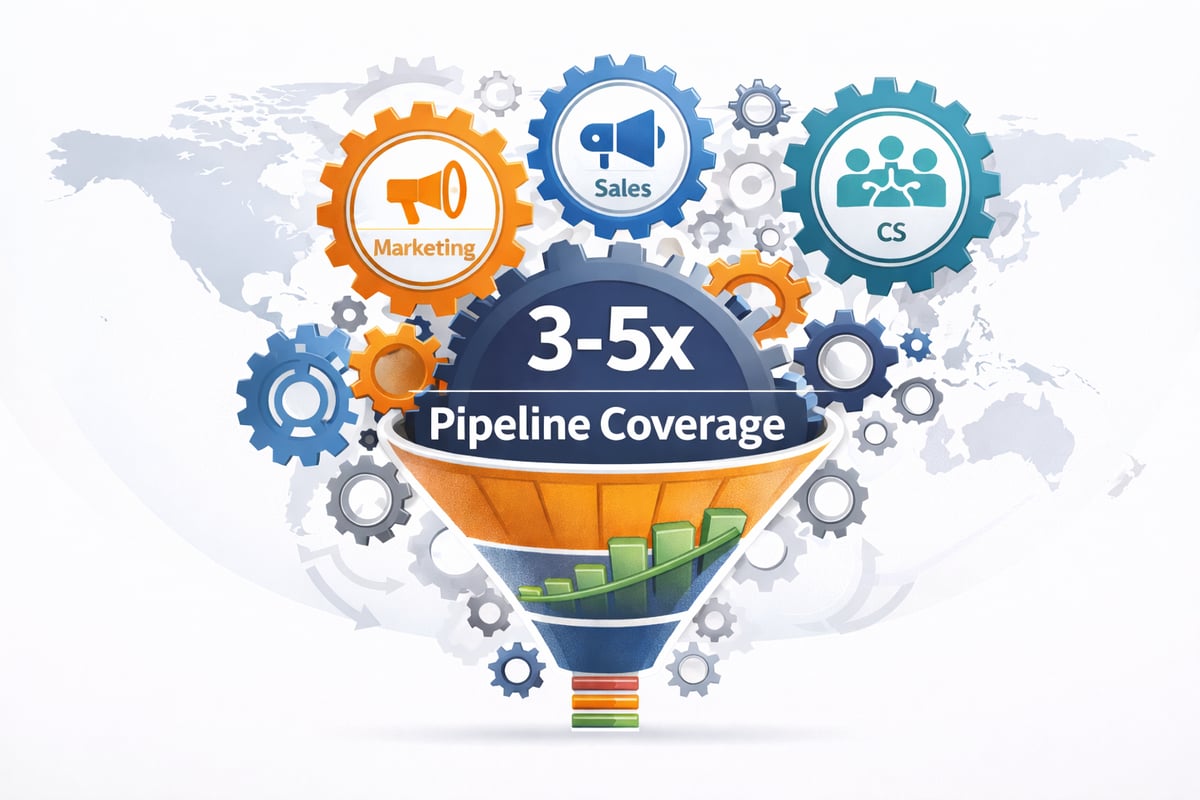
Go To Market Strategy Consulting Guide For 2025 Success

Go To Market Strategy McKinsey Guide For Success 2025
.jpg)
Crossing the Enterprise Chasm: A Practical Guide to Sales-Led Growth (SLG)

Let's Build The Future Together
