
Pipeline Coverage: The Real GTM Metric That Predicts SaaS Revenue


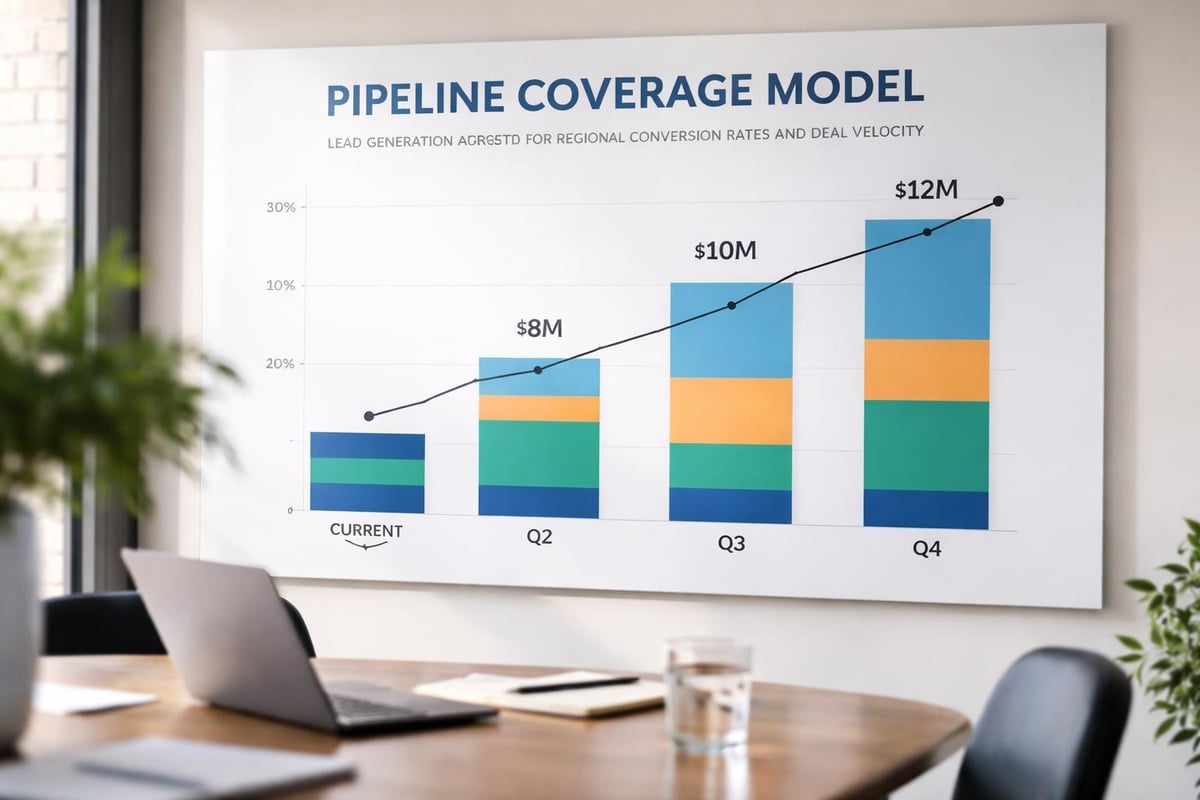
Your board deck shows $12M in pipeline against a $4M quarterly target. Your CRO calls it "healthy." Your CFO nods. Two months later, you miss the quarter by 30%. This story plays out in boardrooms from San Francisco to Munich because most teams treat pipeline coverage as a vanity metric instead of what it actually is: your earliest warning system for revenue failure.
Why Pipeline Coverage Matters More Than Win Rates
Pipeline coverage represents the ratio of qualified pipeline value to quota or revenue target. A 3x coverage ratio means you have $3 in qualified opportunities for every $1 you need to close. Sounds simple. It's not.
The brutal reality: most B2B SaaS companies between $3M and $75M ARR operate with false pipeline coverage. They count opportunities that will never close, stage deals prematurely, and ignore regional conversion variance. US enterprise deals convert at 18-22%. DACH markets? Often 12-15% for the same product due to longer sales cycles and procurement complexity.

The 3-5x Benchmark Framework
Here's what healthy pipeline coverage actually looks like across growth stages:
| ARR Stage | Minimum Coverage | Optimal Coverage | Why |
|---|---|---|---|
| $3M-$10M | 4x | 5-6x | Lower win rates, process immaturity |
| $10M-$30M | 3.5x | 4-5x | Improving conversion, more false pipeline |
| $30M-$75M | 3x | 3.5-4x | Better qualification, multi-regional complexity |
These aren't theoretical. They reflect what metrics-driven GTM engines need to hit revenue targets consistently across geographies.
The multiplier exists because not all pipeline is created equal. Your team will push deals, prospects will ghost, budgets will freeze, and champions will leave. Understanding pipeline coverage means accepting that attrition is structural, not exceptional.
How False Precision Destroys Pipeline Coverage
I worked with a PE-backed SaaS company at $18M ARR showing 4.2x coverage in their CRM. Clean number. The reality: 40% of their pipeline sat in stages three and four for over 90 days with no meaningful activity. When we applied velocity and engagement filters, actual coverage dropped to 1.8x. They missed their quarter by $1.9M.
Common false coverage traps:
- Counting early-stage opportunities at full value
- Ignoring stage duration and deal aging
- Applying uniform win rates across segments
- Overlooking seasonal patterns in EMEA Q3/Q4
- Missing multi-threading requirements in enterprise deals
Real pipeline coverage requires weighted probability by stage, region, and deal characteristics. A $200K opportunity in stage two with a single contact in Germany is not equivalent to a $200K opportunity in stage four with executive alignment in Boston.
Building Coverage Through Disciplined Generation
Pipeline coverage isn't a measurement problem. It's a generation and qualification problem. Most teams discover coverage gaps too late because they treat pipeline creation as a marketing function instead of a cross-functional GTM discipline.
The coverage generation playbook:
- Segment-specific targets: Enterprise coverage needs 5-6x due to longer cycles; mid-market can work with 3-4x
- Regional calibration: DACH markets require 6-9 month lead time; adjust generation 2-3 quarters ahead
- Stage velocity gates: Automatically flag deals aging beyond segment benchmarks
- Multi-channel orchestration: Align SDR, marketing, and partner pipeline against total coverage requirements
- Weekly coverage reviews: Track net new, stage progression, and closed-lost impact on forward quarters
The mathematics are unforgiving. If you need $5M next quarter and your blended win rate is 20%, you need $25M in qualified pipeline today. Not next month. Today. Pipeline management best practices emphasize early disqualification to maintain accurate coverage ratios.
Regional Coverage Complexity in Global GTM
Cross-regional expansion breaks naive pipeline coverage models. Your US playbook showing 3.5x coverage won't translate to EMEA without adjustment. I've watched companies open DACH offices, apply US coverage ratios, and wonder why they miss targets for eighteen months straight.
Regional coverage adjustments:
- US: 3-4x for established segments; 5x for new verticals
- EMEA (UK, Nordics): 4-5x baseline; add 0.5x for enterprise
- DACH: 5-6x minimum; procurement cycles kill naive assumptions
- Emerging markets: 6-8x until you prove repeatable motion
Different regions also require different go-to-market motions. PLG works in US SMB. DACH enterprise demands sales-led with extensive pilot programs. Your coverage model must reflect these realities, not ignore them.
For companies executing GTM Assessment & Operating System Design, regional coverage modeling becomes a core component of expansion planning. You can't forecast EMEA revenue with US assumptions and expect accuracy.

Operationalizing Coverage in Your Forecast Process
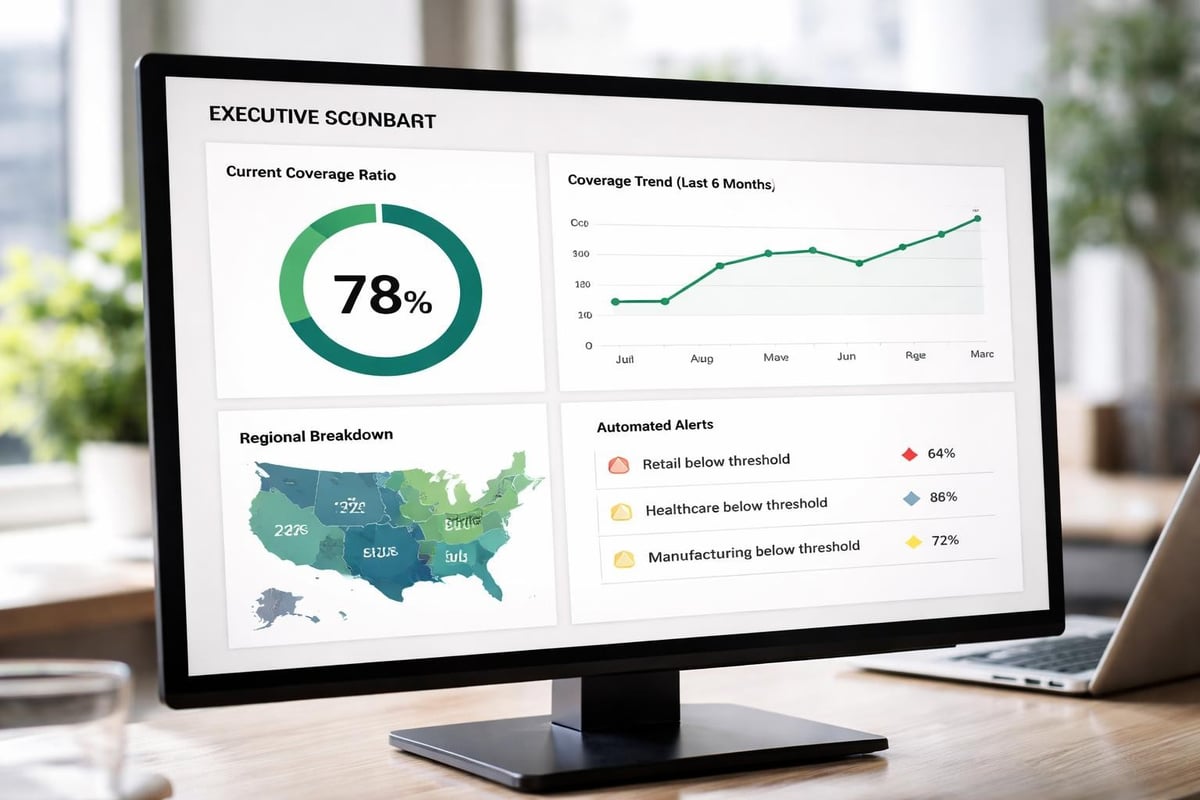
Pipeline coverage should trigger action, not just reports. When coverage drops below threshold, your system should automatically activate generation programs, not wait for the monthly business review.
Coverage-driven operating rhythm:
| Coverage Level | Action Required | Owner | Timeline |
|---|---|---|---|
| Below 2x | Emergency generation sprint | CRO + CMO | Immediate |
| 2x-3x | Accelerate top-of-funnel programs | Marketing | 2 weeks |
| 3x-4x | Maintain current pace | Sales Ops | Ongoing |
| Above 5x | Review qualification standards | RevOps | Monthly |
This isn't about panic. It's about predictable revenue operations that spot problems three months before they hit the P&L. Most boards see revenue misses as execution failures. They're actually forecasting failures that started 90-120 days earlier with inadequate coverage.
The Coverage-Conversion Connection
High pipeline coverage masks conversion problems until it's too late. I've seen teams celebrate 6x coverage while their win rates collapsed from 25% to 12%. More pipeline became a drug that delayed addressing fundamental GTM issues.
Warning signs your coverage is masking problems:
- Coverage increasing but revenue flat or declining
- Stage 2-3 conversion rates dropping quarter over quarter
- Average deal size shrinking despite volume growth
- Sales cycles extending beyond historical benchmarks
- Win rates varying wildly by rep (suggests poor qualification)
Maintaining healthy pipeline coverage requires balancing quantity with quality. Better to have 3x coverage of truly qualified opportunities than 5x coverage of garbage that clogs your sales capacity and destroys forecast accuracy.
The fix isn't more leads. It's tighter qualification, clearer ICP alignment, and ruthless stage discipline. When I implement sales-marketing alignment frameworks, pipeline coverage typically drops 20-30% in month one as we purge bad opportunities. Then it rebuilds with deals that actually close.
Pipeline coverage is the difference between predictable revenue and quarterly chaos, but only when measured and managed with regional precision and ruthless qualification discipline. If you're struggling with coverage accuracy, conversion variance across markets, or false pipeline bloat, GTM Consult helps B2B SaaS companies build the operating systems that deliver 3-5x pipeline coverage that actually converts. Led by Ralf Paschen with 20+ years executing across US, EMEA, and DACH markets, we don't just audit your metrics-we rebuild the engine that generates reliable coverage and predictable revenue growth.

Latest From
The Blog

Go To Market Strategy Consulting Guide For 2025 Success


Go To Market Strategy McKinsey Guide For Success 2025
.jpg)
Crossing the Enterprise Chasm: A Practical Guide to Sales-Led Growth (SLG)

Let's Build The Future Together
